MySQL Join Performance
Earlier this week I was curious about the performance of JOINs in MySQL. How severe is the performance hit of joins? How much slower is a string join over an integer join? I decided to do some tests, and I’m going to share my results here.
I did these tests on a computer with the following specs and software:
- 3.2 GHz Pentium 4
- 2 GB of RAM
- Windows XP
- MySQL 5.0.51b running in development mode (no query caching)
CREATE TABLE `parents` (
`id` int(10) unsigned NOT NULL auto_increment,
`uuid` varchar(128) default NULL,
`time` datetime default NULL,
`string` varchar(128) default NULL,
PRIMARY KEY  (`id`),
UNIQUE KEY `uuid` (`uuid`),
KEY `time` (`time`),
KEY `string` (`string`)
)

CREATE TABLE `children` (
`id` int(10) unsigned NOT NULL auto_increment,
`uuid` varchar(128) default NULL,
`parent_id` int(10) unsigned NOT NULL,
`parent_uuid` varchar(128) default NULL,
`time` datetime default NULL,
`string` varchar(128) default NULL,
PRIMARY KEY  (`id`),
UNIQUE KEY `uuid` (`uuid`),
KEY `parent_id` (`parent_id`),
KEY `parent_uuid` (`parent_uuid`),
KEY `time` (`time`),
KEY `string` (`string`)
)
I filled these tables with records using the following Ruby code:
require 'mysql'
require 'digest/sha1'
require 'base64'

RECORDS = 10_000
stringS = ['blue', 'red', 'green'].freeze

my = Mysql::new("localhost", "user", "password", "db_perf")

my.query("DELETE FROM parents")
my.query("DELETE FROM children")
my.query("ALTER TABLE parents  AUTO_INCREMENT = 1")
my.query("ALTER TABLE children AUTO_INCREMENT = 1")

def make_uuid(arg)
Digest::SHA1.hexdigest(arg.to_s)
end

start_time = Time.now.tv_sec
(1..RECORDS).each do |i|
if ((i % 500) == 0)
puts "Iteration #{i}"
time    = Time.now.tv_sec
elapsed = time - start_time
time_per_record = elapsed.to_f/i
time_to_complete = time_per_record * RECORDS
puts "Minutes to complete: #{time_to_complete/60}"
end

uuid   = make_uuid(i)
time   = Time.at(i * 3600).strftime('%Y-%m-%d %H:%M')
string = stringS[i % stringS.length]
res    = my.query(
"INSERT INTO parents " +
"(uuid, time, string) VALUES " +
"('#{uuid}', '#{time}', '#{string}')" )
res    = my.query(
"INSERT INTO children " +
"(uuid, time, string, parent_id, parent_uuid) VALUES " +
"('#{uuid}', '#{time}', '#{string}', #{i}, '#{uuid}')" )
end

puts ''
puts 'DONE'
end_time = Time.now.tv_sec
elapsed = end_time - start_time
puts "Elapsed time in minutes: #{elapsed.to_f/60}"
The table engine you use and the character encoding will make a difference. Why? Because the engine will affect how keys are stored and used, and the character encoding will affect the speed of string comparisons.
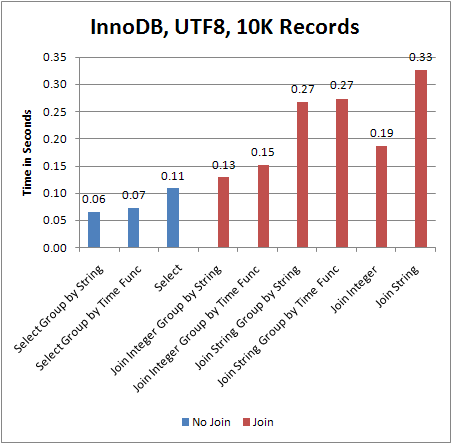
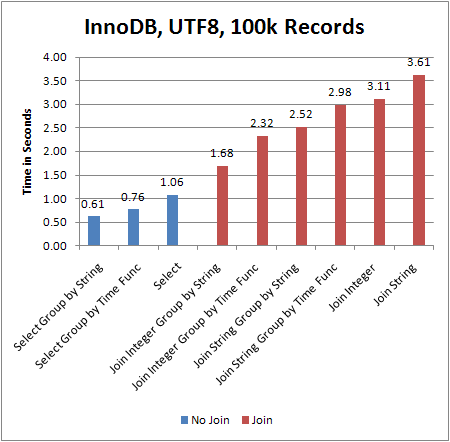
I use Rails these days, and when dealing with Rails, InnoDB (which is transactional) and UTF8 are common, so let’s look at them:
Blue designates queries without a join. They are:
| Select Group by String | SELECT * FROM children GROUP BY string |
| Select Group By Time Func | SELECT * FROM children GROUP BY YEAR(time), DAYOFYEAR(time) |
| Select | SELECT * FROM children |
Red designates queries with a join, which are:
| Join Integer Group by String | SELECT * FROM children INNER JOIN (parents) ON (children.parent_id = parents.id) GROUP BY parents.string |
| Join Integer Group by Time Func | SELECT * FROM children INNER JOIN (parents) ON (children.parent_id = parents.id) GROUP BY YEAR(children.time), DAYOFYEAR(children.time) |
| Join String Group by String | SELECT * FROM children INNER JOIN (parents) ON (children.parent_uuid = parents.uuid) GROUP BY parents.string |
| Join String Group by Time Func | SELECT * FROM children INNER JOIN (parents) ON (children.parent_uuid = parents.uuid) GROUP BY YEAR(children.time), DAYOFYEAR(children.time) |
| Join Integer | SELECT * FROM children INNER JOIN (parents) ON (children.parent_id = parents.id) |
| Join String | SELECT * FROM children INNER JOIN (parents) ON (children.parent_uuid = parents.uuid) |
The 10K queries were run 10 times, and the 100K queries were run 6 times. I did a warmup round before each measured round (so for a 10K query, that means 10 times to warmup, 10 times to measure). The times you see in the charts are the average times. Be sure to turn off query caching.
The results speak for themselves, so I’m offering them up with no analysis for now.


